EKS · Central VPC Infrastructure
Design and validate a scalable Kubernetes-based platform architecture with centralized network and observability design.
Role: As team lead, architected an EKS-based platform with multi-layer autoscaling using KEDA and Karpenter. Designed Central VPC and Transit Gateway architecture to centralize shared services. Validated platform stability under 2,000 RPS with zero downtime.
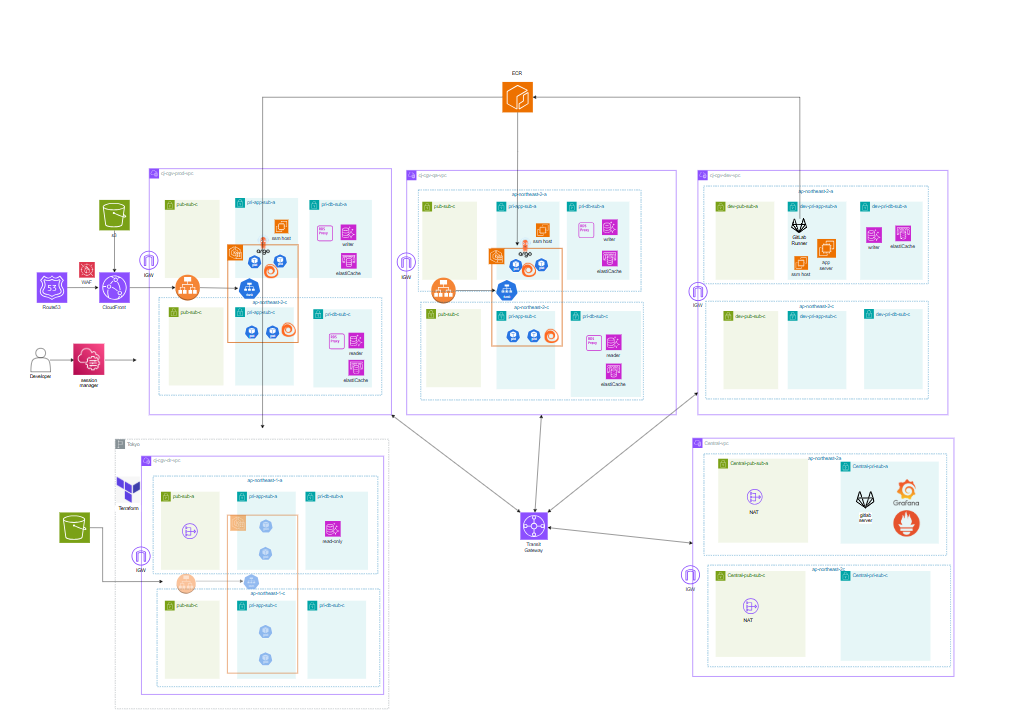
The overall structure is divided into Prod, QA, Dev, DR, and Central VPCs. Prod and QA share an EKS-based architecture with CloudFront → ALB (Ingress) → Kubernetes Service → Pod flow, deployed across multiple AZs for availability. The data layer uses Aurora DB + Reader Endpoint + RDS Proxy for read traffic distribution and connection stability. Prod runs On-Demand + Spot NodePools separately; QA uses Spot-focused nodes for cost savings. Central VPC hosts a GitLab server and monitoring stack for centralized multi-environment management. DR is designed as Pilot Light to minimize standby cost while enabling recovery when needed. DNS query flow is Route 53 Resolver → DNS Firewall (ALERT) → Query Logging → CloudWatch Logs → Metric Filter → Alarm → SNS → Lambda → Slack Alert.
Design Rationale
EKS was chosen for its extensibility and ecosystem integration — not just deployment convenience. Its compatibility with KEDA, Karpenter, and IRSA, and the ability to manage deployments consistently via Helm Charts, were key factors. Central VPC reduces operational complexity by centralizing shared services and consolidating logs, alerts, and status from multiple VPCs into a single point. In short, it's not a design that 'splits the network' — it's a design that reduces operational, security, and observability touchpoints.
Chosen to manage infrastructure as code, reduce manual configuration errors, and maintain a reproducible Pilot Light DR structure.
Suited for a complex operational environment requiring traffic autoscaling, monitoring, GitOps, and open-source integrations — with strong compatibility with KEDA, Karpenter, and IRSA.
Determined that request-volume-based scaling was more appropriate than CPU/memory metrics. Designed to compute average RPS per Pod from Prometheus metrics and scale accordingly — from a minimum of 45 to a maximum of 110 Pods.
Increasing Pod count alone was insufficient — schedulable nodes also needed to scale. Designed to automatically provision new nodes upon detecting Pending Pods.
Adopted to maintain consistent deployment state based on Git and clearly track operational change history.
Used to consistently manage app deployments, monitoring stacks, and autoscaling configurations.
Collects /actuator/prometheus metrics to enable KEDA to make request-volume-based scaling decisions.
Applied to avoid concentrating permissions on node-level IAM roles — instead granting only the necessary permissions per ServiceAccount to minimize the security blast radius.
Configured to track external domain access from Central VPC servers and rapidly deliver threat domain detection events to Slack.
- Issue
- Under heavy load, multiple risks coexisted: traffic hitting unready Pods, slow scaling relative to request volume, and Pending Pods due to insufficient nodes. In practice, node join failures, Pending Pods, MaxPods limits, and ALB health check path mismatches recurred repeatedly.
- Analysis
- Analyzed issues by layer: Spring Boot must not receive requests immediately after startup, making readiness criteria critical. HPA alone couldn't adequately reflect actual request volume. Additionally, Private Subnet routing errors prevented worker nodes from communicating with the EKS API, causing join failures; DNS misconfigurations left nodes NotReady; and MaxPods limits caused Pending Pods.
- Solution
- Designed multiple layers to work in concert rather than relying on a single solution. Separated startup/readiness/liveness probes and aligned ALB health check paths with readiness. Replaced CPU-based scaling with Prometheus-metric-driven KEDA to scale by average RPS per Pod, and pre-scaled a minimum of 45 Pods to ensure initial capacity. Applied Karpenter to automatically provision new nodes when Pending Pods are detected, and used IRSA for per-Pod permission isolation.
- Result
- Sustained approximately 2,000 RPS for 60 seconds in QA, processing 120,000 total requests. This was the result of 45 pre-scaled Pods, aligned readiness/ALB health check criteria, Prometheus-driven KEDA scaling, Karpenter node scaling, and GitOps-based operational consistency all working together.
⚙ Improvements
Validated an EKS-based large-scale traffic handling architecture with real requests. Centralized GitLab, monitoring, and security observability via Central VPC to reduce operational complexity and improve visibility. Built a DNS Firewall + Query Logging + Slack Alert flow to detect and immediately surface network security events.
△ Regrets
Resource specs were not refined enough during load testing, resulting in budget overruns. Karpenter was not fully integrated into the GitOps flow, and DNS Firewall was primarily used in ALERT mode without extending to blocking policies.
→ Next Steps
Next steps include full GitOps coverage including Karpenter, enhancing Central VPC security policies with BLOCK/detection rules, and refining cost prediction based on load testing.